BigQuery Integration
Connect Google BigQuery to power your metrics with custom SQL queries.
Overview
Segflow enables teams to align around metrics that reflect real impact — not just vanity data. By connecting Google BigQuery, you can import any time-series data directly from your data warehouse into Segflow metrics.
This makes it easy to connect operational analytics to strategic initiatives, visualize results on Flow Boards, and run analyses across the same metrics that power your business dashboards.
How It Works
Segflow connects to your Google Cloud project using a service account credential. Once connected, it executes your defined SQL query, expecting a consistent two-column output:
| Column | Type | Description |
|---|---|---|
date | DATE | The date for each time-series data point |
value | FLOAT or INTEGER | The metric value for that date |
Each metric runs its query on schedule and stores the results as time-series data for analysis, correlations, and forecasting.
Segflow never modifies your BigQuery data — it only reads results from your defined query.
Setup Instructions
1. Create a Service Account
Download your Google Cloud service account credentials JSON file. If you’re new to this, follow the official Google guide: Creating and Managing Service Accounts
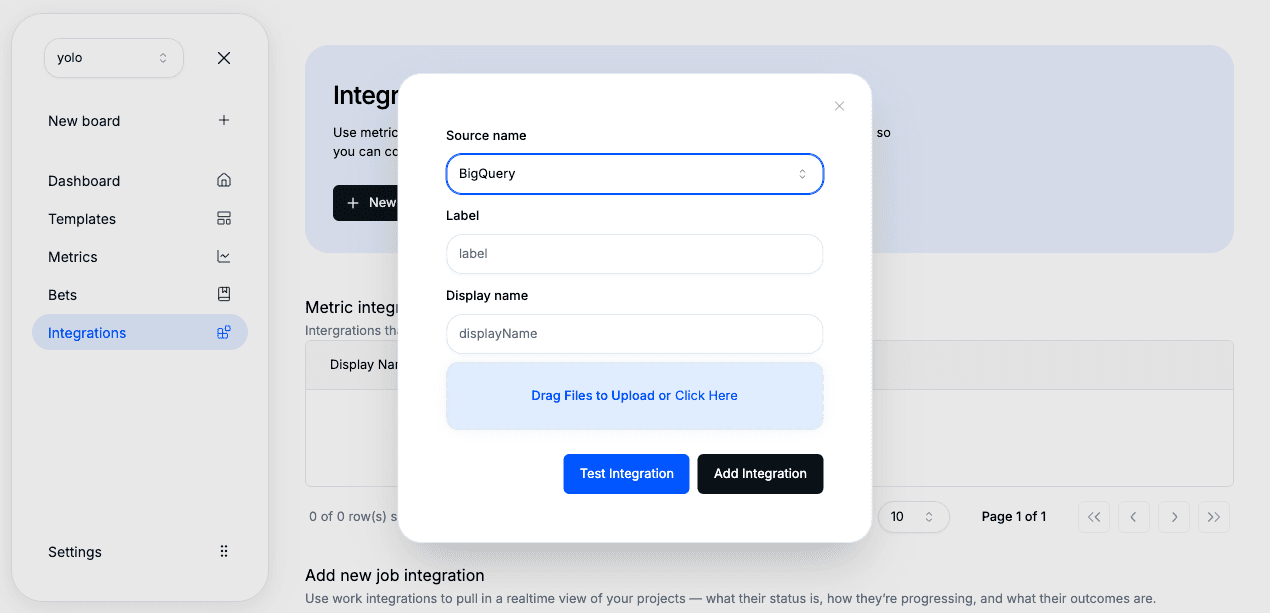
2. Open Integrations in Segflow
In the sidebar, go to Integrations.
3. Add a New Integration
Click “New Integration”, then select Google BigQuery as your source.
4. Upload Credentials
Upload your service account JSON file from Step 1.
5. Save
Click Save — your BigQuery connection will appear in the integrations list.
Adding BigQuery as a Source to a Metric
1. Create or Edit a Metric
Go to the Metrics section and create a new metric (or edit an existing one).
2. Choose Source
Select Google BigQuery as the source type.
3. Write Your Query
Enter a SQL query that returns the required columns:
SELECT
  DATE(created_at) AS date,
  COUNT(user_id) AS value
FROM `your_dataset.user_events`
GROUP BY date
ORDER BY date;
Test your query directly in BigQuery first to ensure it returns the correct data.
4. Save and Run Query
Click Update Metric → Run Query to fetch your first dataset.
5. Verify Data
You’ll see the imported data visualized in the Overview tab of your metric. From here, you can place it on a Flow Board and connect it to strategic bets or other metrics.
Data Refresh
Once connected, BigQuery-based metrics refresh automatically according to your organization’s configured schedule (daily by default). You can also manually trigger updates from the metric page.
Troubleshooting
If your query doesn’t return data or you encounter an error:
- Ensure your service account has BigQuery Data Viewer access.
- Verify that your query returns columns named date and value.
- Check your SQL syntax and run the query directly in BigQuery to confirm results.
- Make sure your integration credentials haven’t expired or been revoked.
Next Steps
- Learn how to connect other warehouse tools like Postgres
Explore Metric Sources
Understand how imported metrics connect to Flow Boards