Settings
Metric Types
Flow’s strategy mapping tool is inspired by Amplitude’s North Star Playbook, created by John Cutler and Jason Scherschligt. This framework provides a structured model to define how work and metrics relate to each other.
There are three types of metrics in Segflow, positioned along a spectrum from leading to lagging indicators:
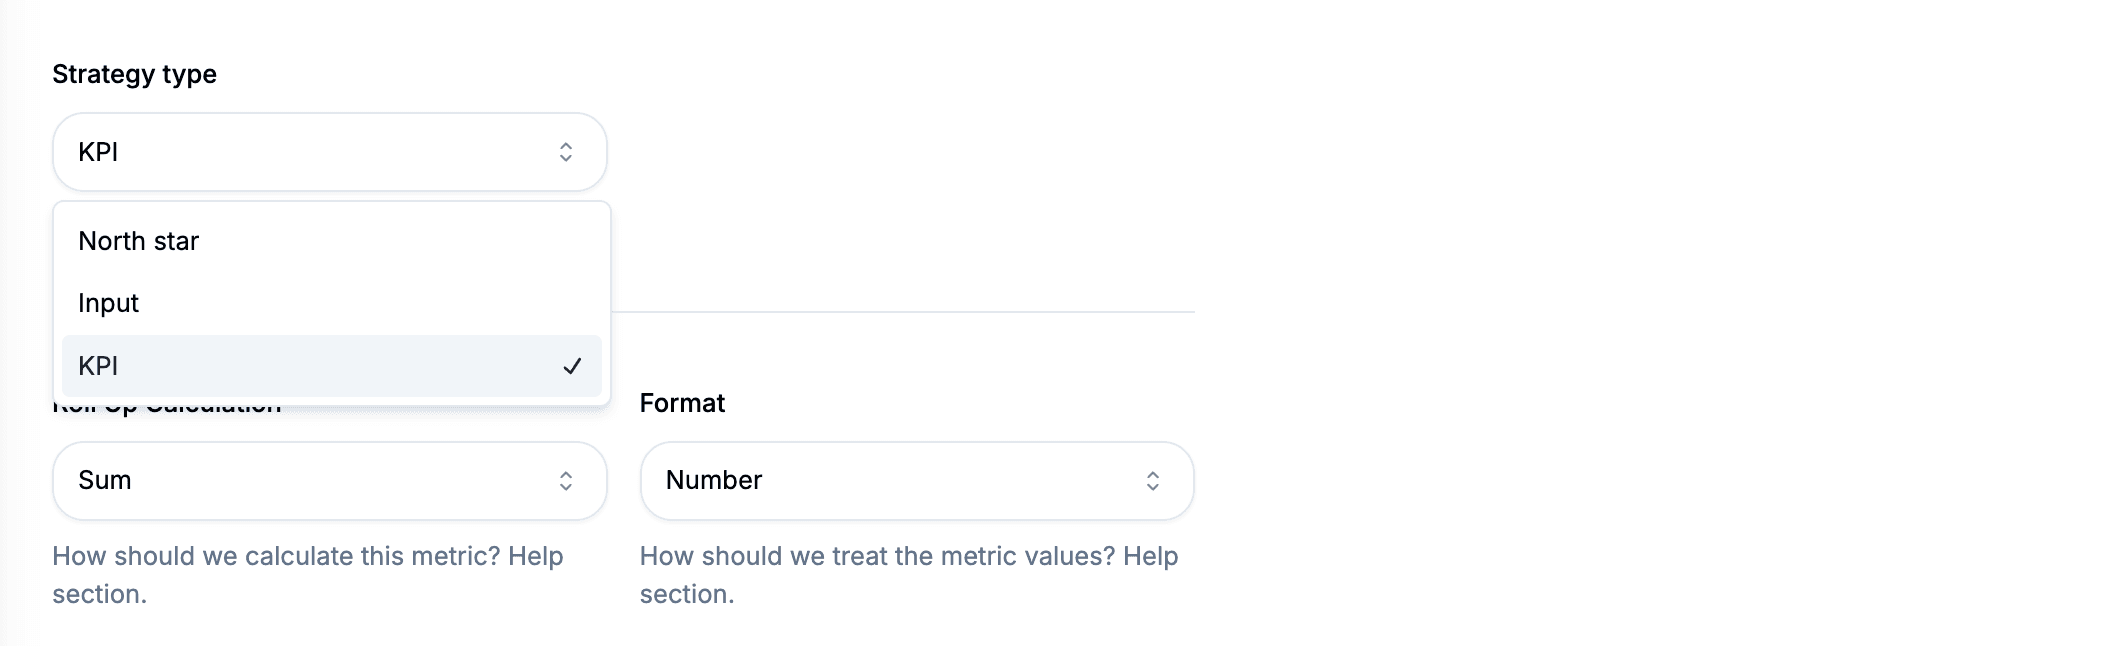
- Input Metrics – Leading indicators influenced by work. For example, the percentage of users performing a specific action during a session. While important, they do not directly represent business success.
- North Star Metric – Measures the value delivered to customers. Increasing this metric generally leads to happier users and business growth. It serves as a bridge between leading and lagging indicators. A rule of thumb: each product should have one North Star Metric.
- Business KPIs – Lagging indicators that measure business success, such as revenue or customer retention. Since they are subject to external factors, they are difficult to influence directly through work.
Roll-Up Calculations
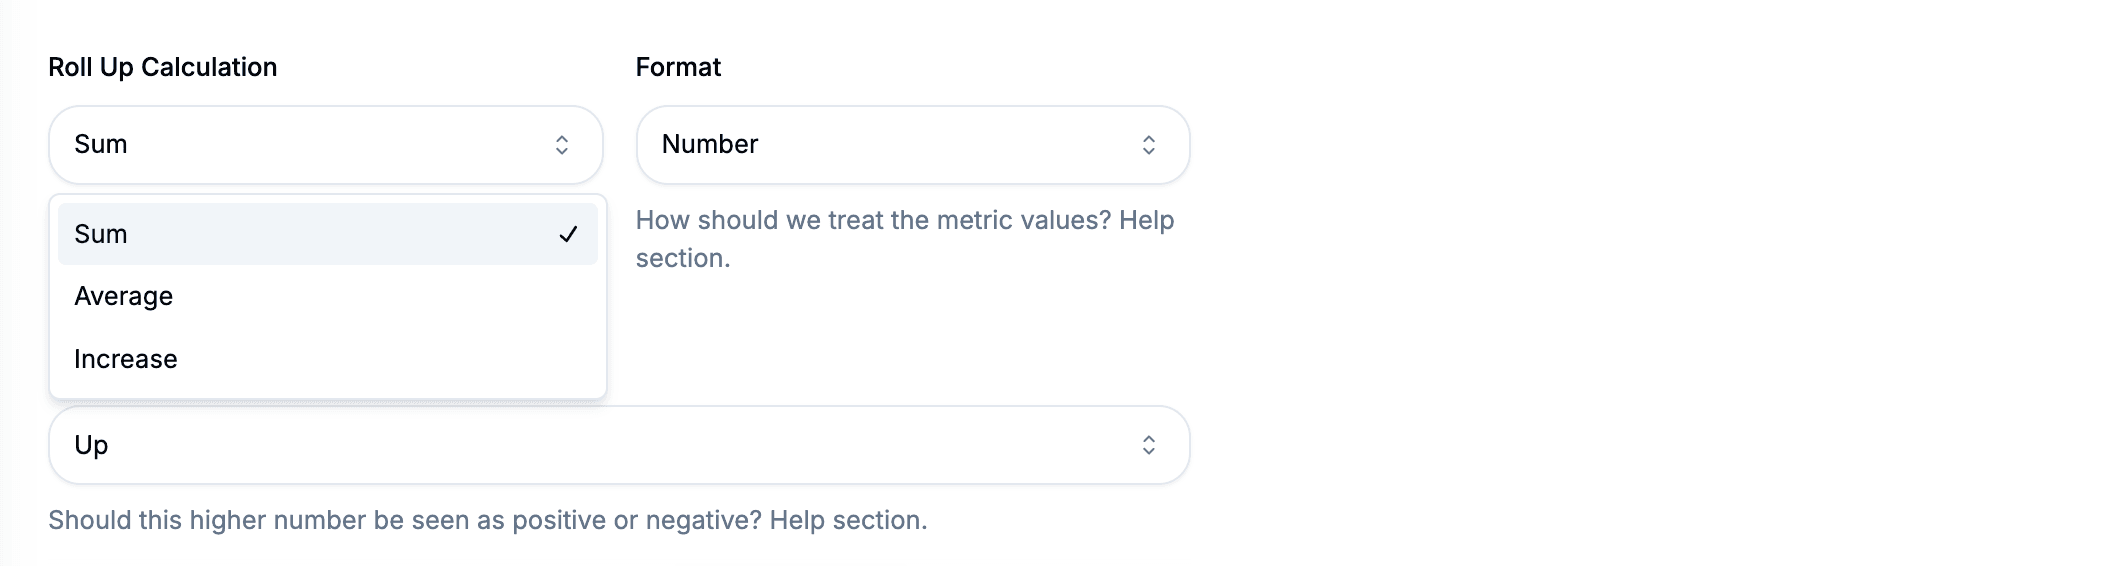
Selecting the right roll-up calculation depends on the nature of the metric. Below is an explanation of how each calculation works and when to use it.
| Roll-Up Calculation | How It Works | When to Use It |
|---|---|---|
| Sum | Sums the metric values for each time interval. | Best for metrics that track the total count of something (e.g., total sales per day). |
| Average | Averages the metric values for each time interval. | Suitable for metrics that cannot be summed, such as “Daily Active Users” or percentages. |
| Amount Increased | Subtracts the value at the beginning of the interval from the value at the end. | Ideal for cumulative metrics, like total subscriber growth over time. |
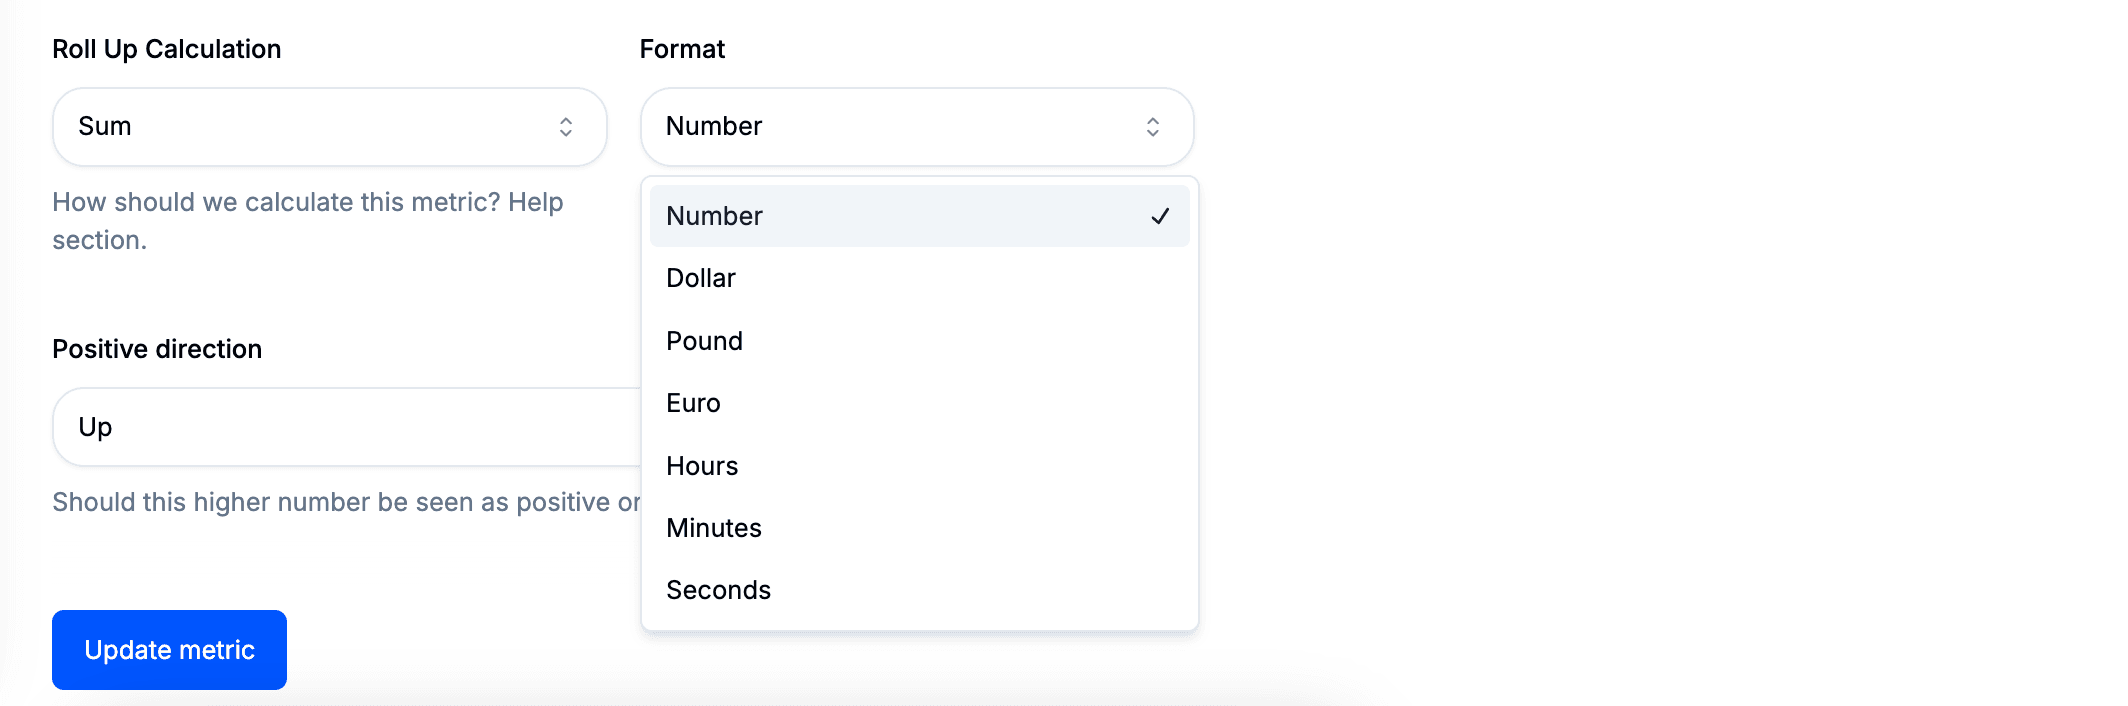
Format
The format setting controls the symbol displayed alongside metric values. For instance, when tracking Revenue, selecting a currency format ensures that values appear correctly.
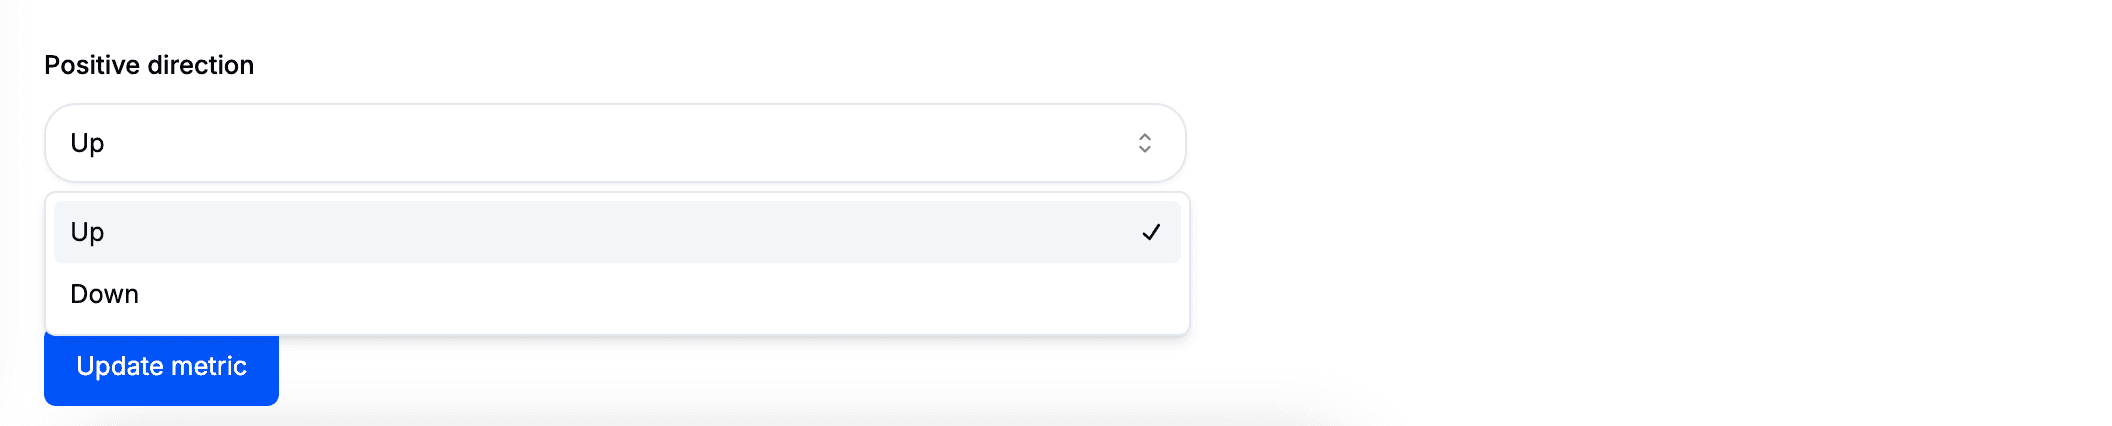
Positive Direction
The percentages displayed beneath each metric indicate performance changes compared to the previous period of the same length.
For example, if a metric’s roll-up value is 5 for the last 7 days and was 4 in the previous 7-day period, the percentage change would be 25%.
Formula for Percent Change:
(Current Period - Previous Period) / Previous Period