Get Started
Up and running in ~5 minutes
This quickstart gets you from a blank account to your first Flow Board with metrics, bets, relationships, and a first analysis (Driver or Bet Impact). If you prefer to explore, you can also start from a template.
1 Sign up
Create your Segflow account with GitHub, Google, or email.
2 Create your Organization
Your Organization is the home for Flow Boards, Metrics, Bets, and Reports.
- Organization name — e.g., Acme Co
That’s it. You can add more detail later.
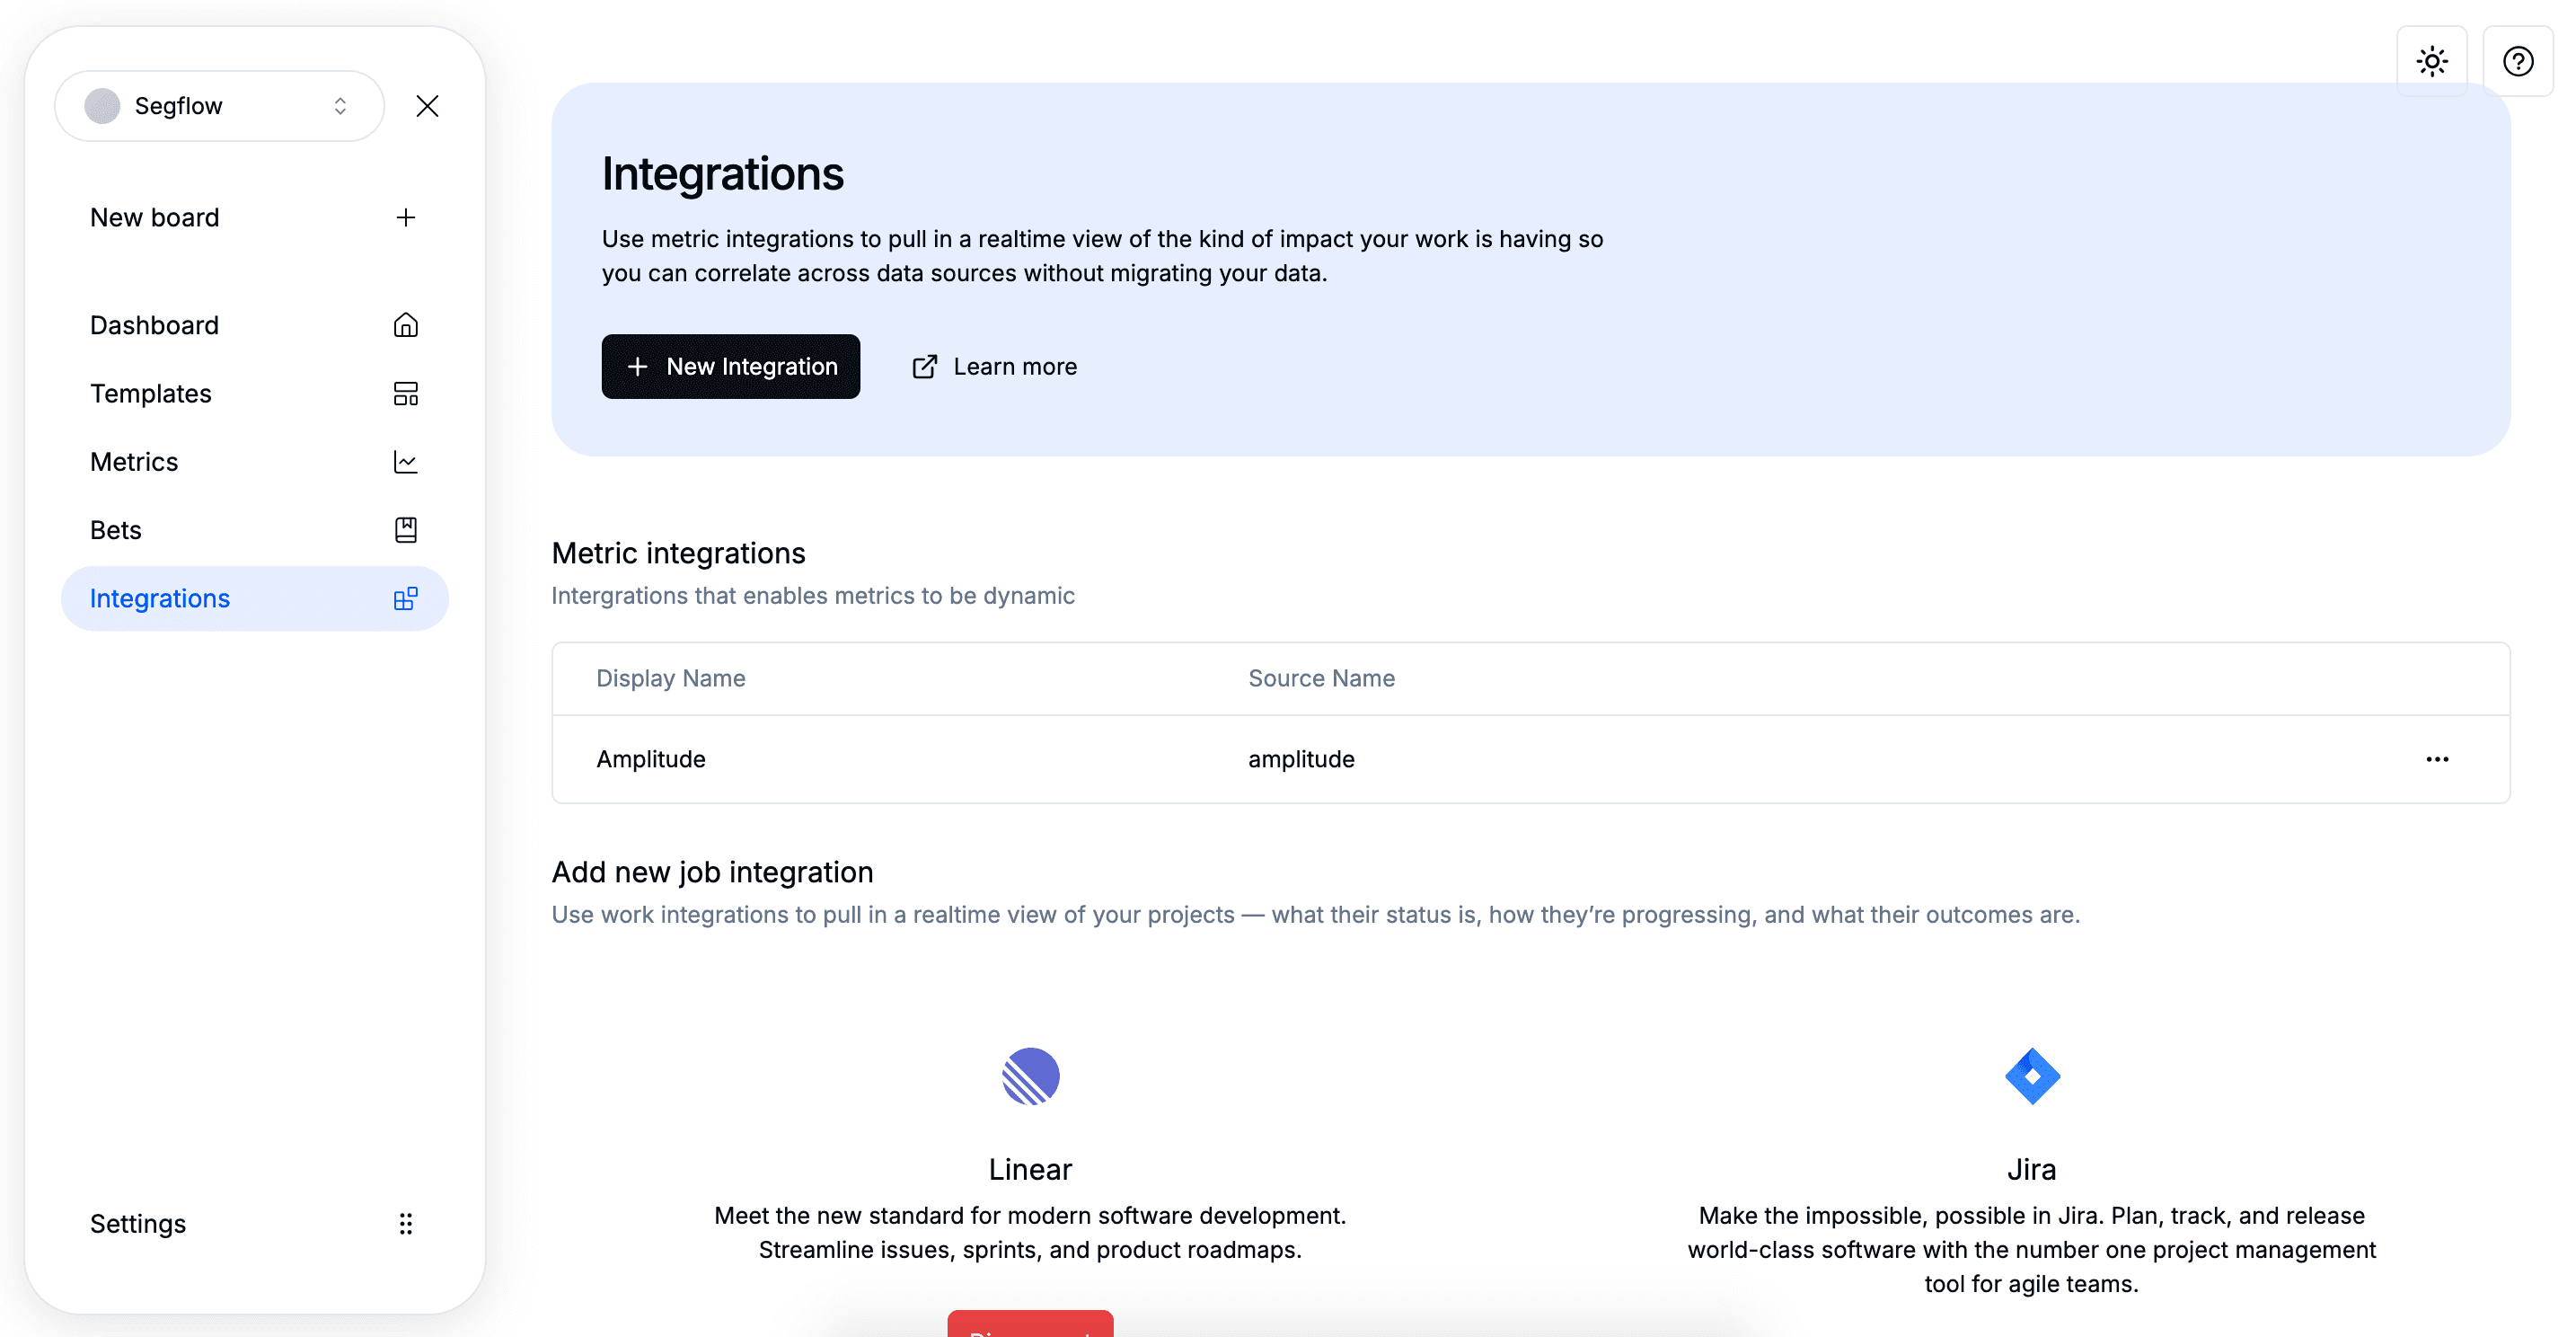
3 Connect data (optional but recommended)
Hook up the systems that power your metrics (analytics, revenue, marketing spend).
- Pick an integration and authenticate
- Choose the metrics you want to import
- Confirm frequency & units (daily/weekly/monthly)
No production data yet? Use a sample metric to walk through the flow. You can swap in real sources later.
4 Start your first Flow Board
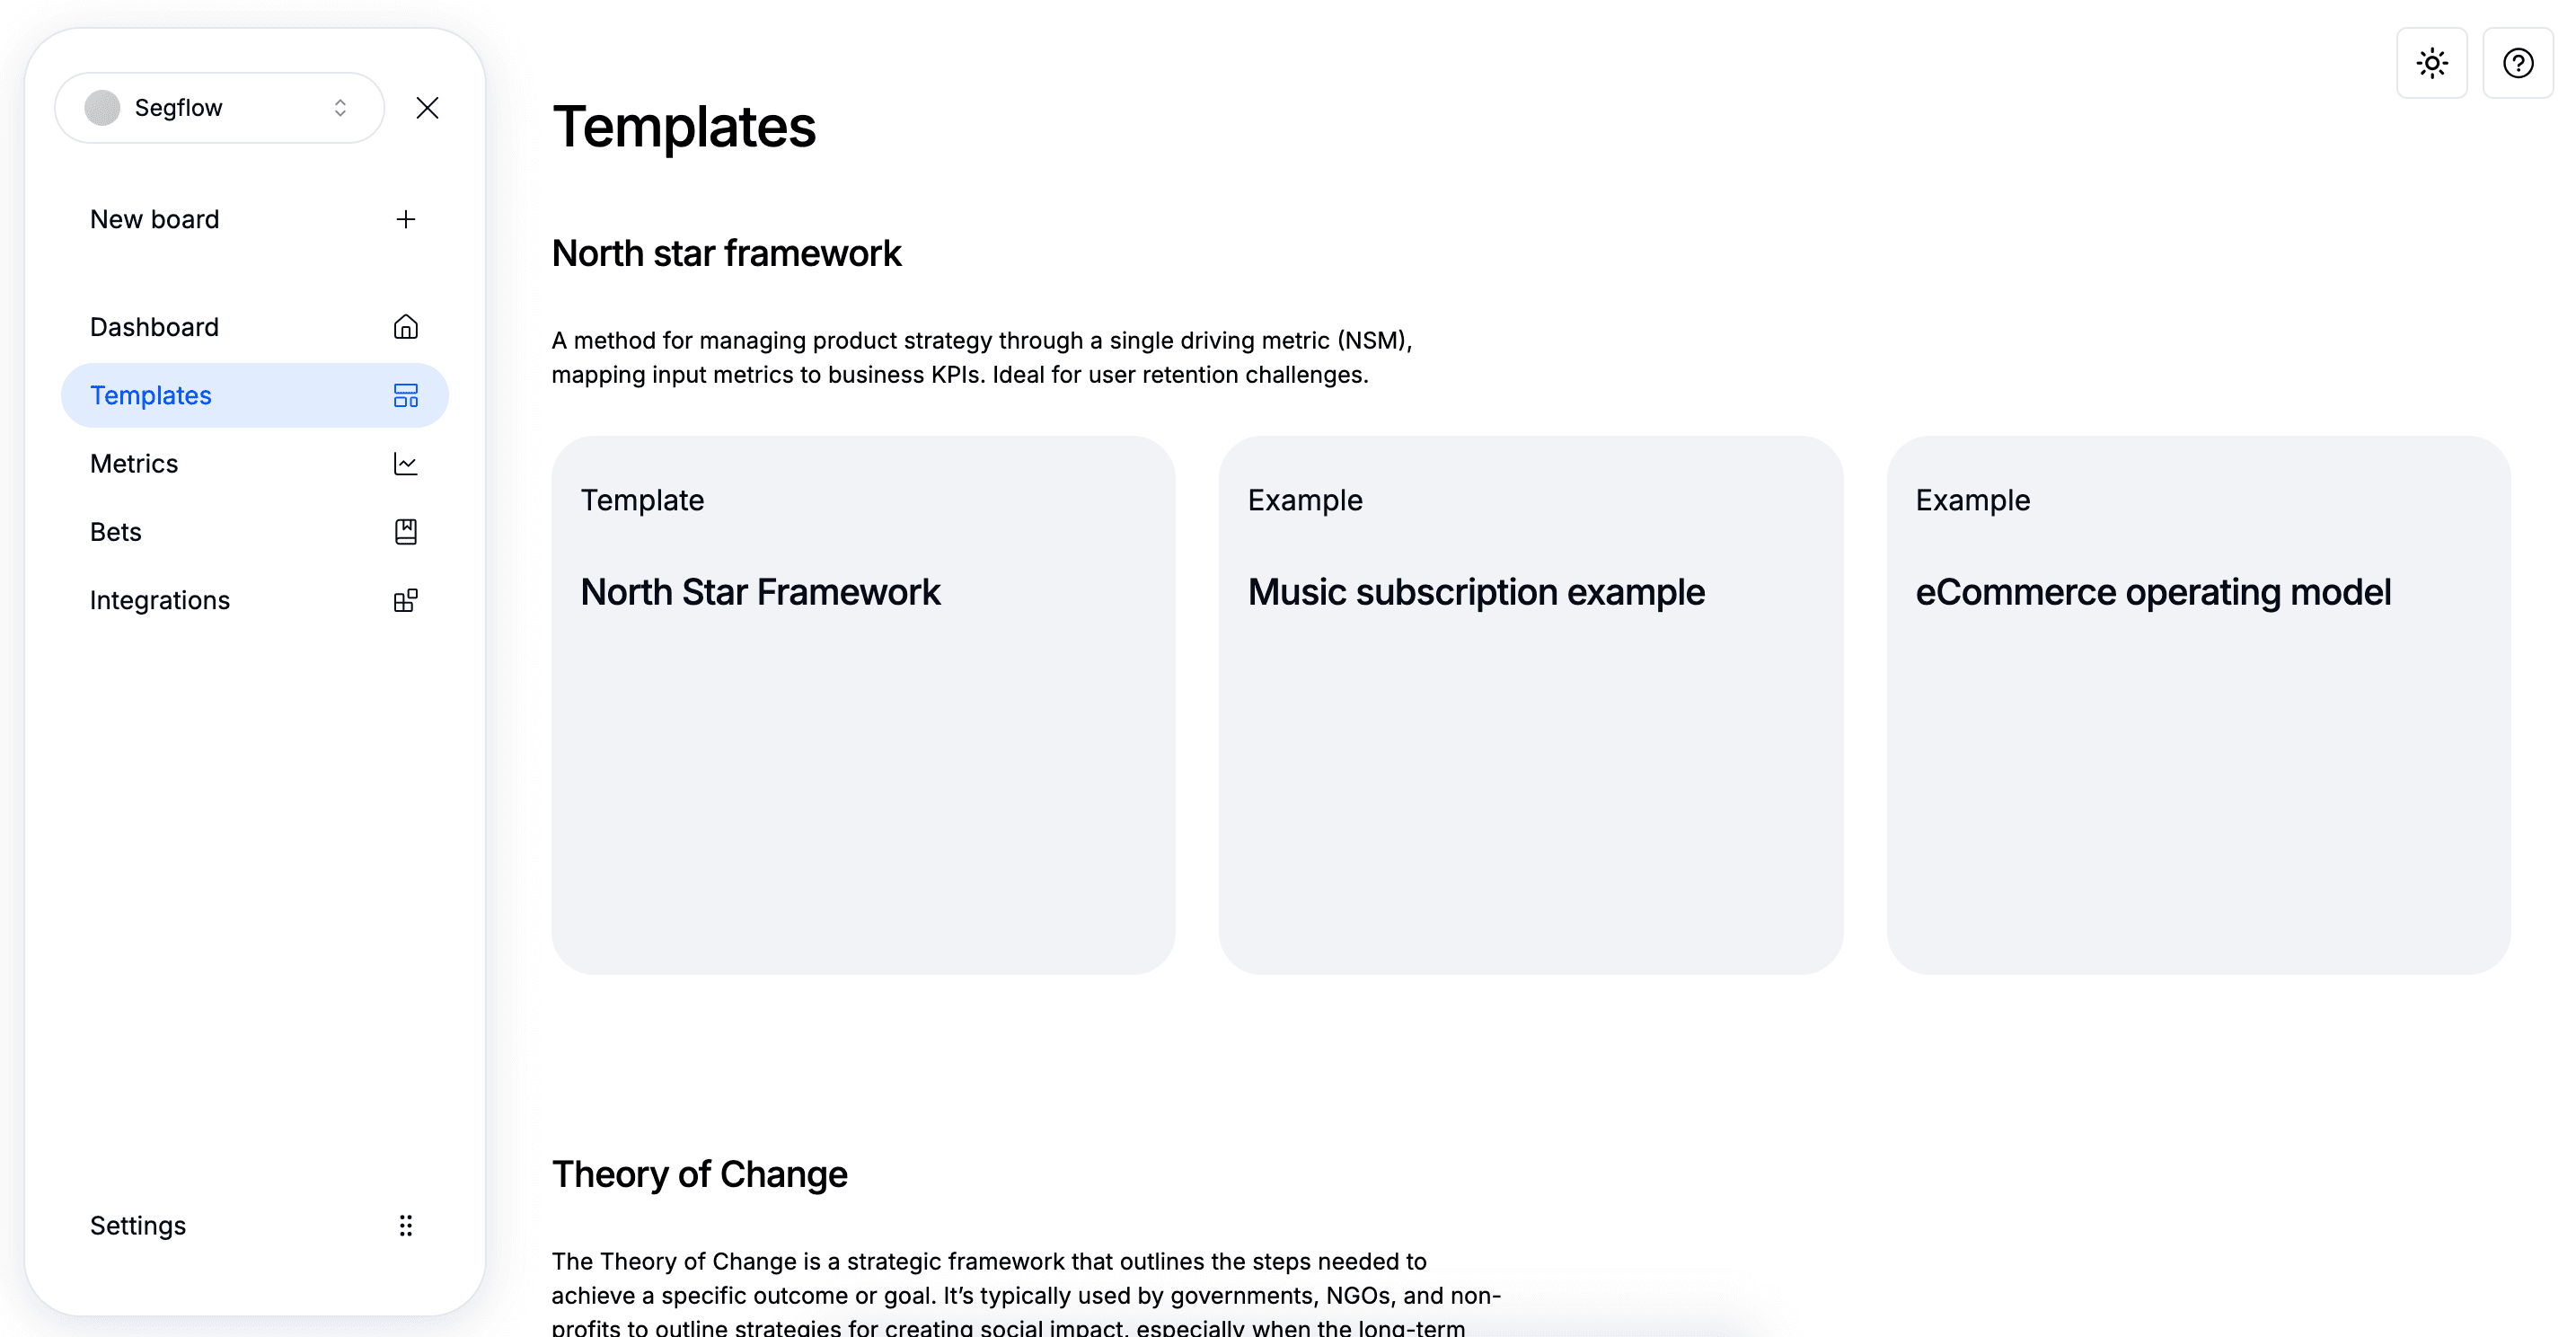
Create a new Flow Board (or pick a Template to begin faster).
Templates
Templates include pre-wired structures for common jobs-to-be-done:
- North Star & Drivers — map KPI and key drivers
- Quarterly Planning — compare/commit bets
- Growth Loops — identify compounding systems
- Marketing Allocation — connect spend to outcomes
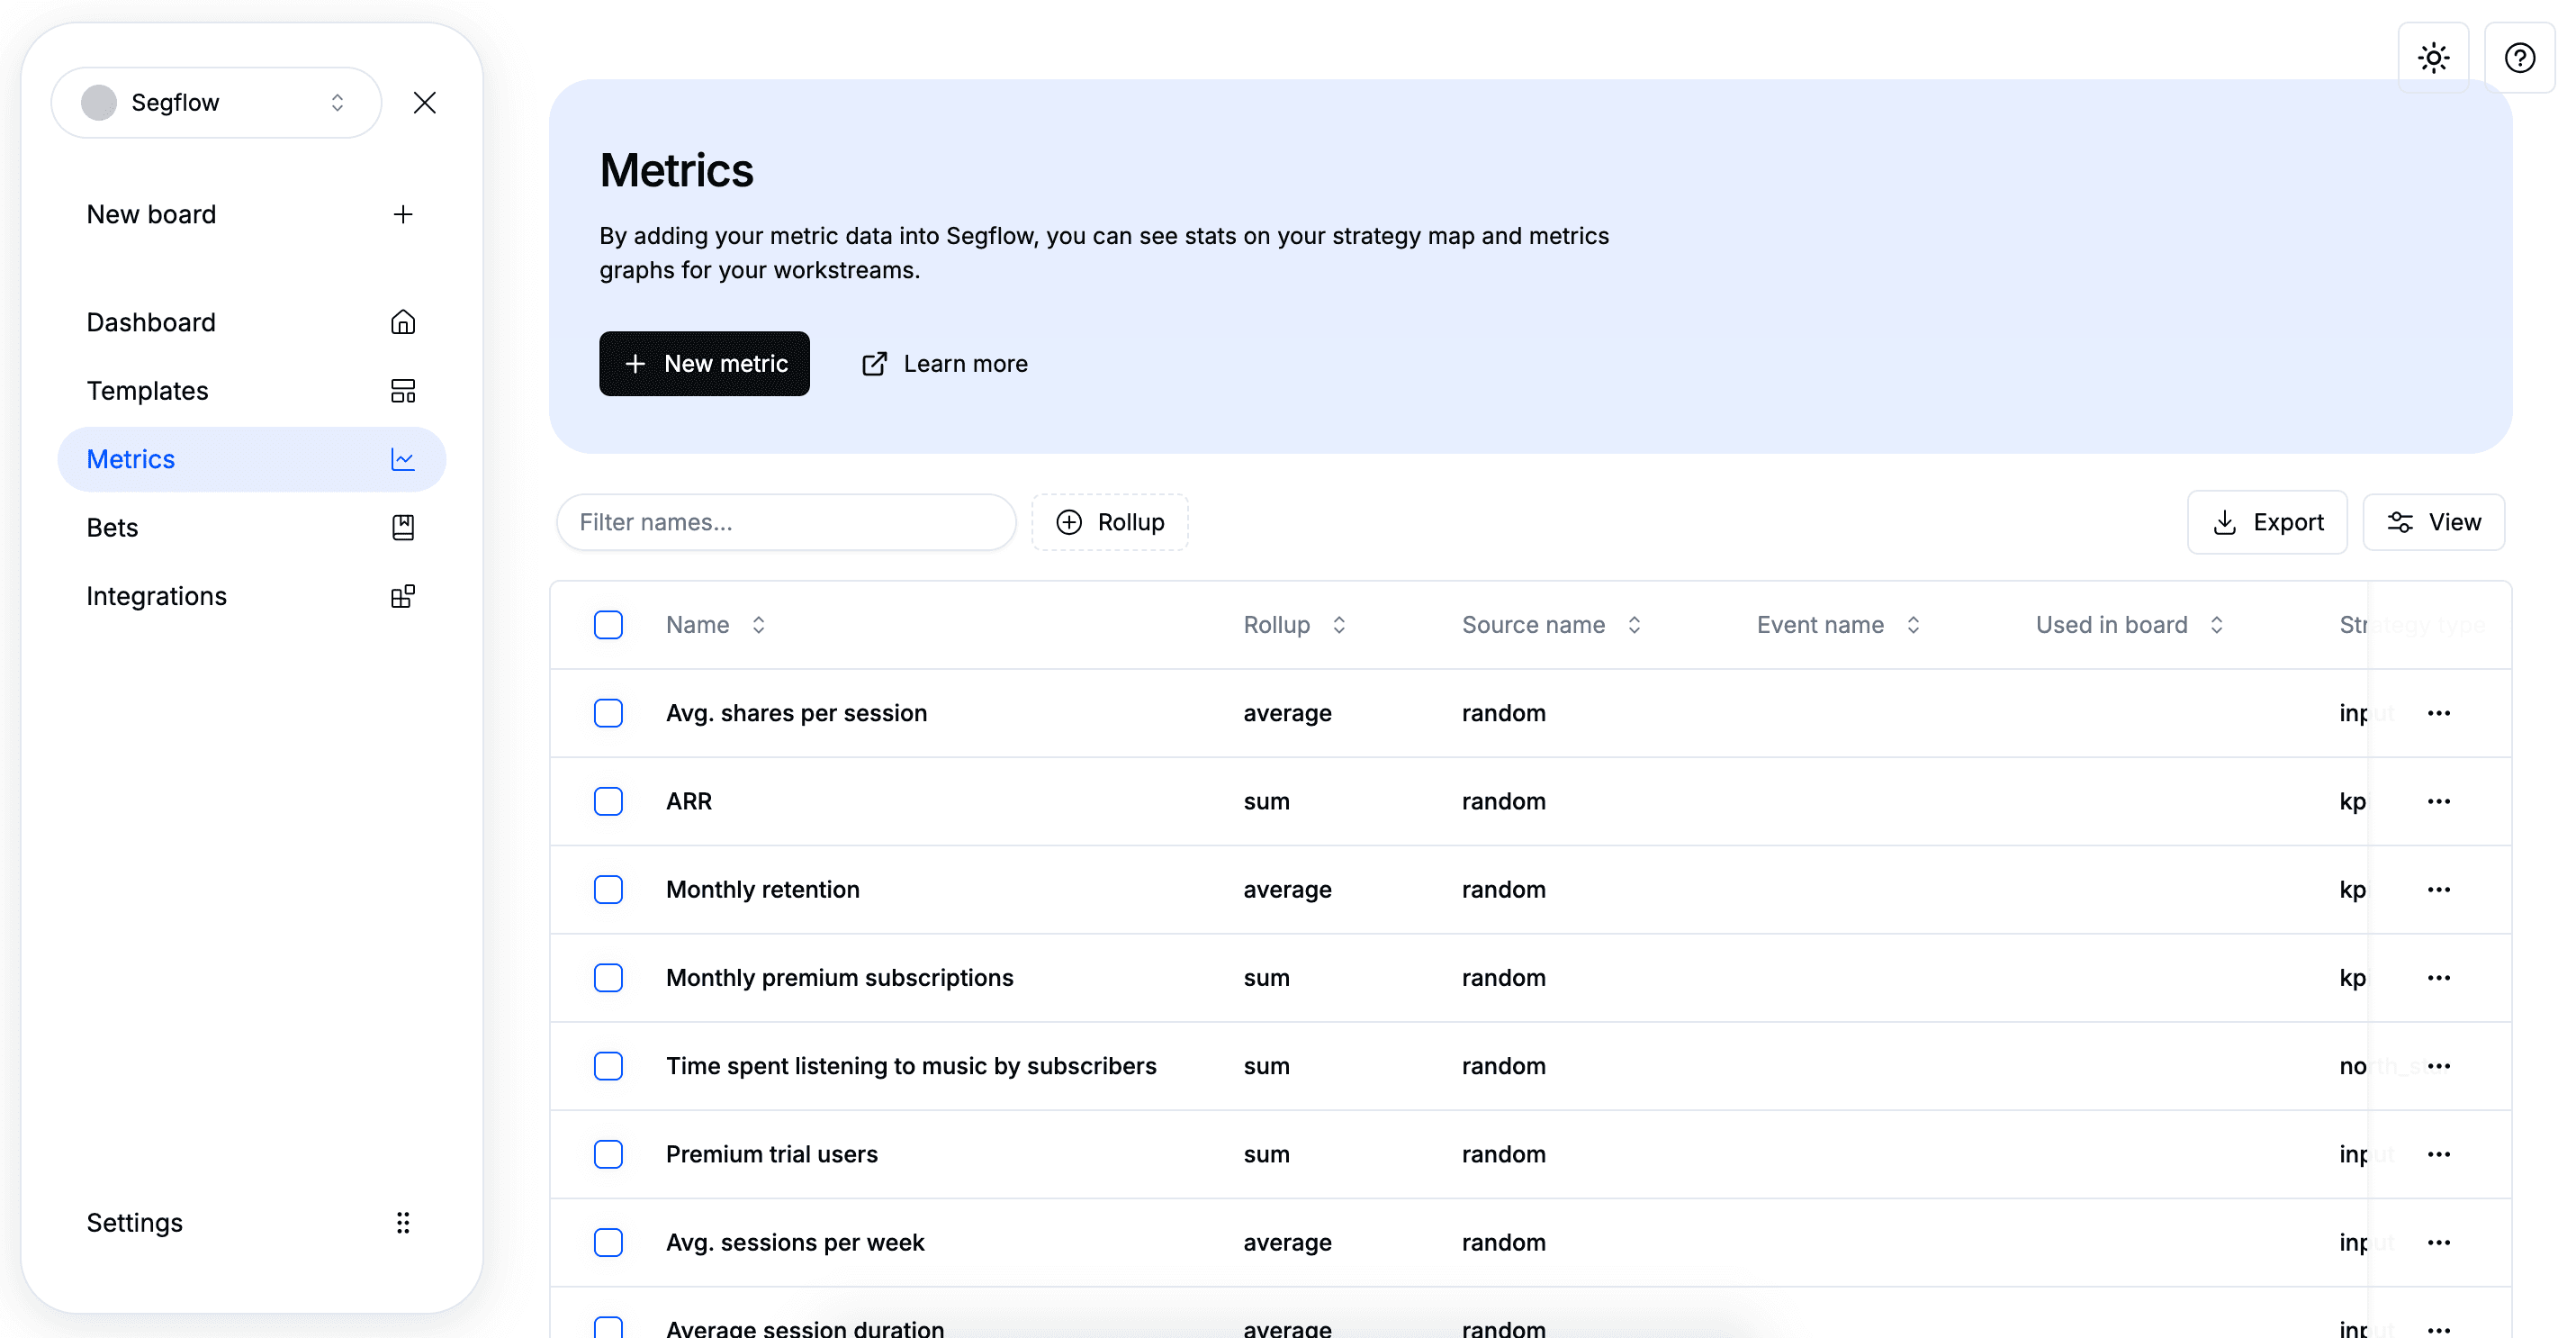
5 Add Metrics
Bring in (or create) metrics that represent outcomes and drivers.
- Select from integrations or create manually
- Set owner, unit, direction (up is good / down is good)
- (Optional) Set targets for visibility
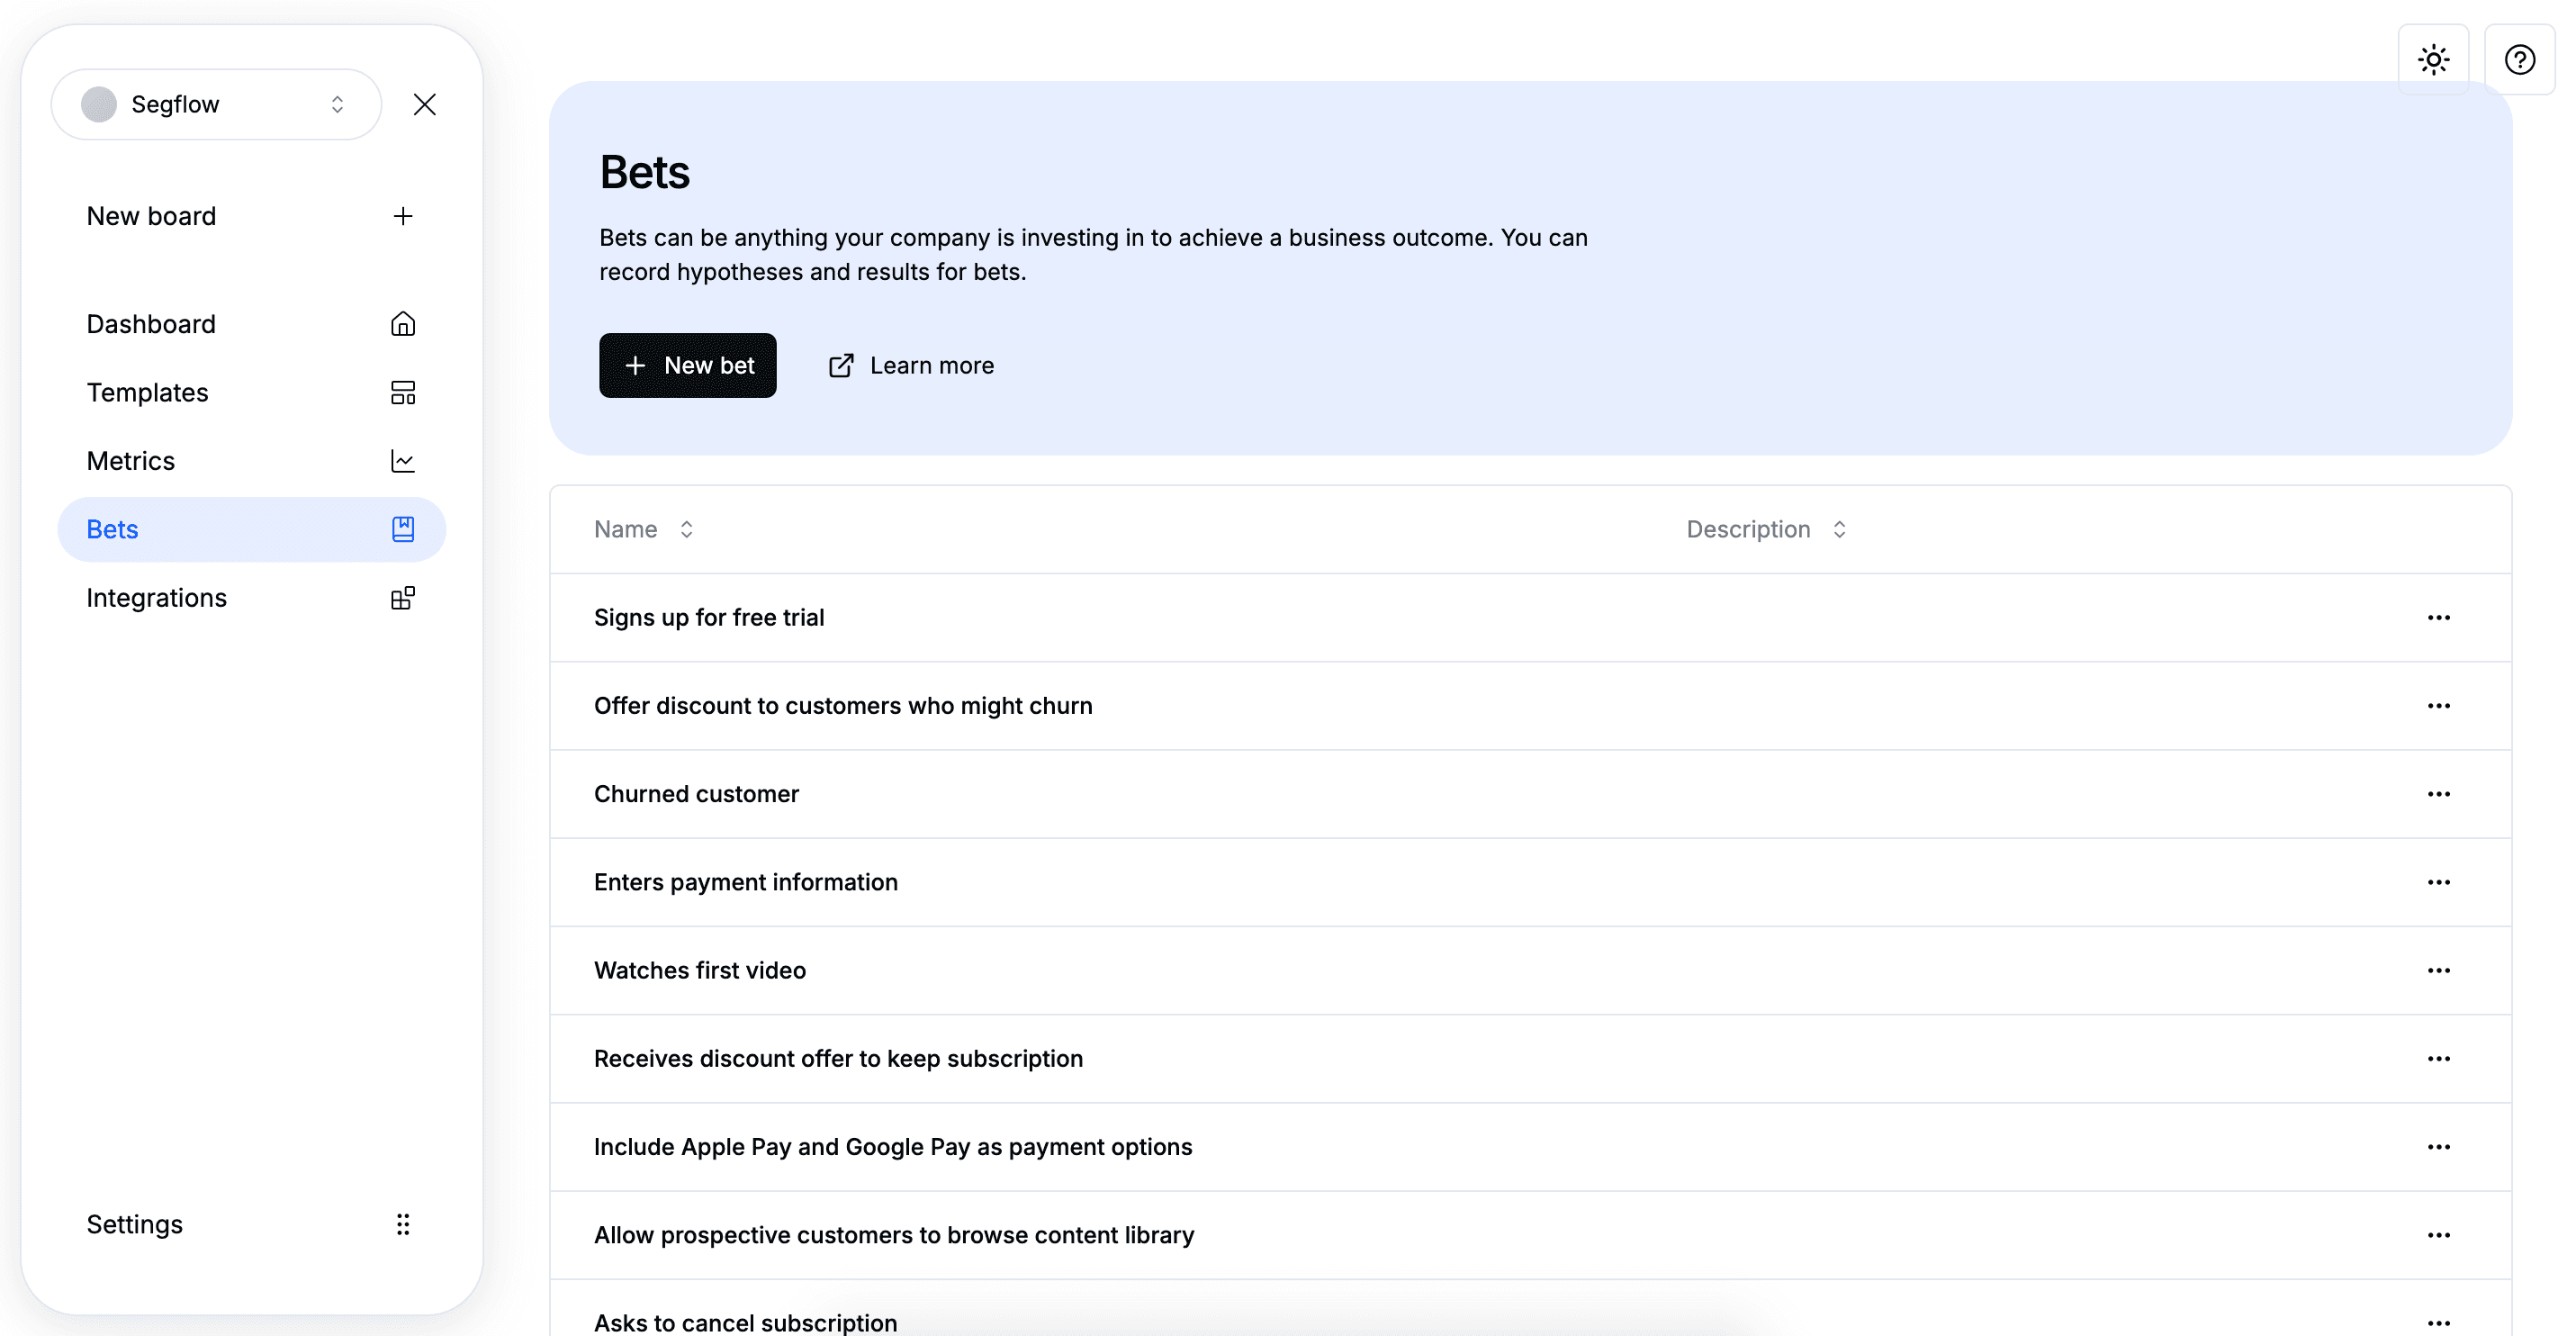
6 Add Bets
Create bets (strategic initiatives) you expect to move metrics.
- Add hypothesis, expected impact (absolute/%), confidence, reach, effort
- Link work items (Jira/Linear) inside the bet (we don’t show tasks as separate items on the board)
7 Create relationships
On the Flow Board, connect what influences what:
- Bet → Metric: the bet contributes to the metric
- Metric → Metric: a driver influences an outcome
- Bet → Bet: one initiative enables/blocks another
Enrich relationships with type (drives/enables/blocks/contributes), confidence, reach, and lag. These details improve analysis quality.
8 Run your first analysis
From the board, open Run Analysis and choose one based on your setup:
- Driver Analysis (Metric ↔ Metric): find which drivers most influence your KPI
- Bet Impact Analysis (Bet → Metric): estimate which bets have the highest leverage
- Growth Loop Analysis (closed loops): measure loop gain & ripple effects
- Marketing Mix Analysis (channel spend → outcome): optimise budget across channels
Choose scope
Select the target metric (for Driver/MMM) or relevant bets (for Bet Impact).
Review results
Inspect influence/contribution, confidence ranges, and timing.
Save as Report
Save the run for history and sharing. Reports stay linked to this Flow Board.
9 Invite teammates
Bring product, growth, and leadership into the same context.
- Share the Flow Board
- Tag owners on metrics/bets
- Review Reports together for decisions
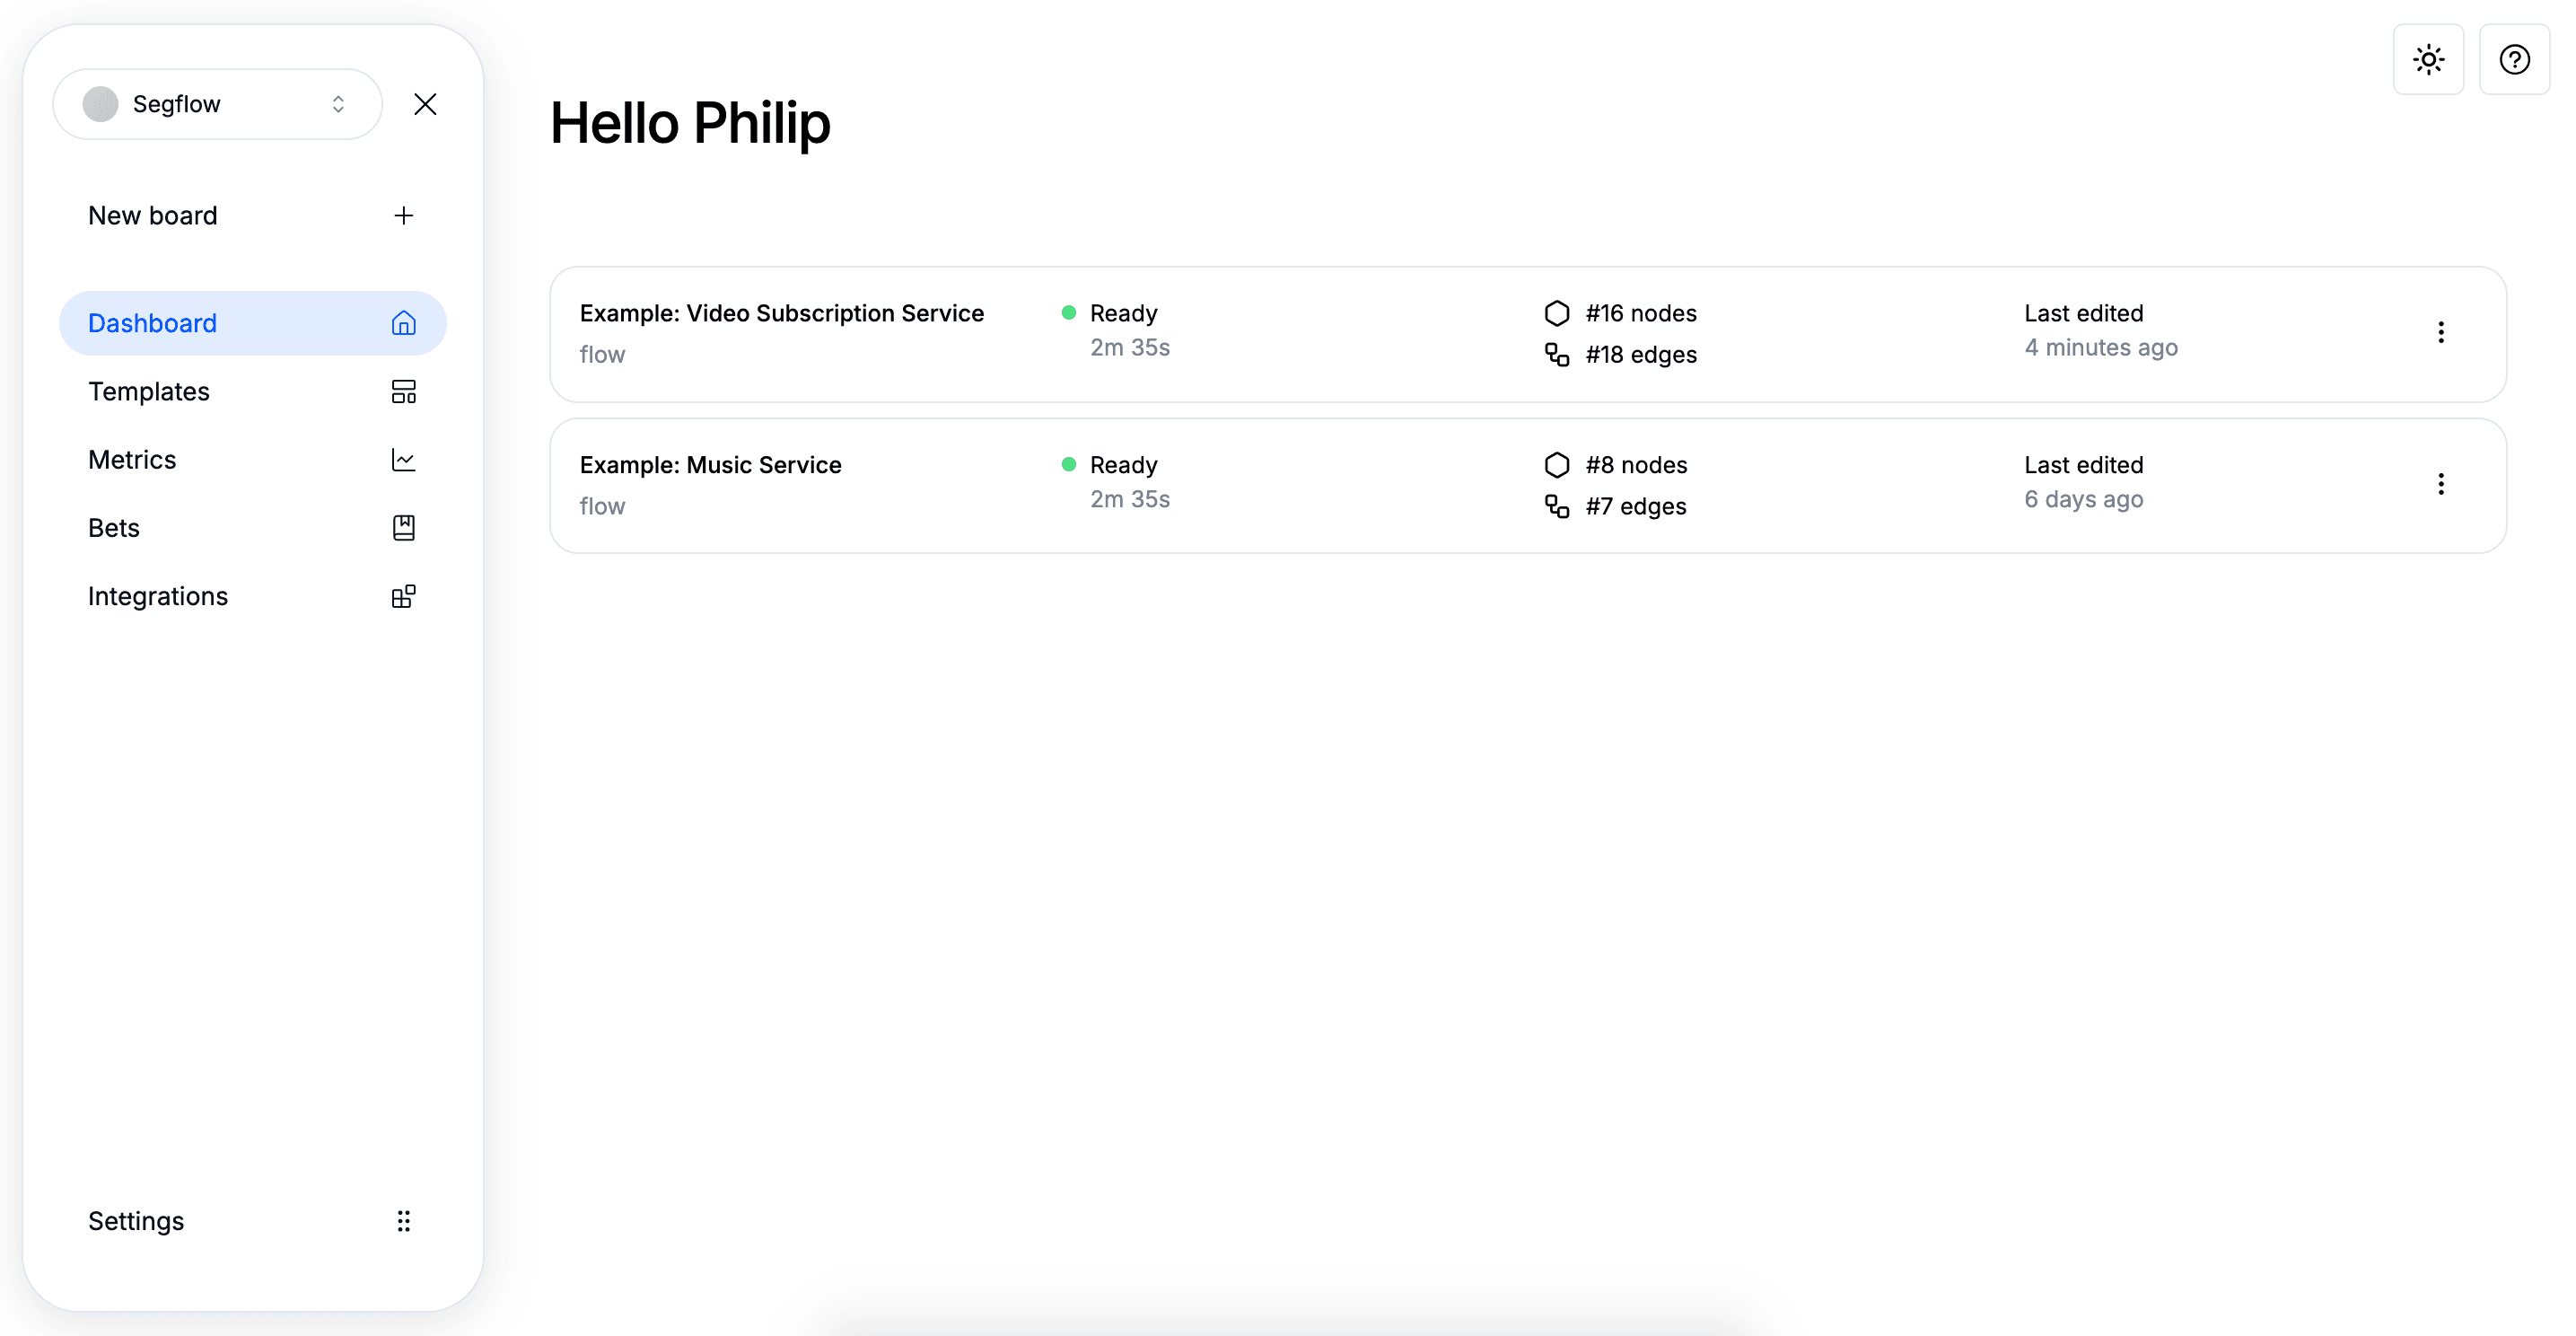
Organization Dashboard
Your home for recent boards, reports, and integrations.
Tips & good practices
- Start small: 3–5 metrics and 2–3 bets is plenty for a first pass
- Be explicit: add confidence, reach, and lag to relationships
- Link work inside bets: keep strategy and execution connected (without cluttering the board)
- Iterate often: compare expected vs. actual; update relationships as you learn
Next up: explore the Flow Board concept page, then dive into individual Strategic Analyses (Driver, Bet Impact, Growth Loop, Marketing Mix) for deeper guidance.