Amplitude Integration
Connect Amplitude to power your metrics with live behavioral data.
Overview
Segflow enables teams to align on a metrics-driven strategy — connecting product analytics directly to business outcomes.
By integrating Amplitude, you can import live product data — such as events, funnels, or saved charts — and link them to your Flow Boards. This lets you analyze how user behavior drives your North Star metrics, supports strategic bets, and influences key outcomes like activation, retention, or revenue.
How It Works
Amplitude integration connects to your Amplitude project via API Key and Secret Key. Once connected, Segflow can:
- Fetch data from individual events or saved charts
- Transform them into time-series metrics
- Keep them automatically updated on schedule
- Use them in analyses like Driver Analysis, Bet Impact, and Growth Loops
Amplitude data flows through your sources — powering metrics that can be placed on Flow Boards and linked to strategic bets.
Setup Instructions
1. Open Integrations
In Segflow’s sidebar, click Integrations.
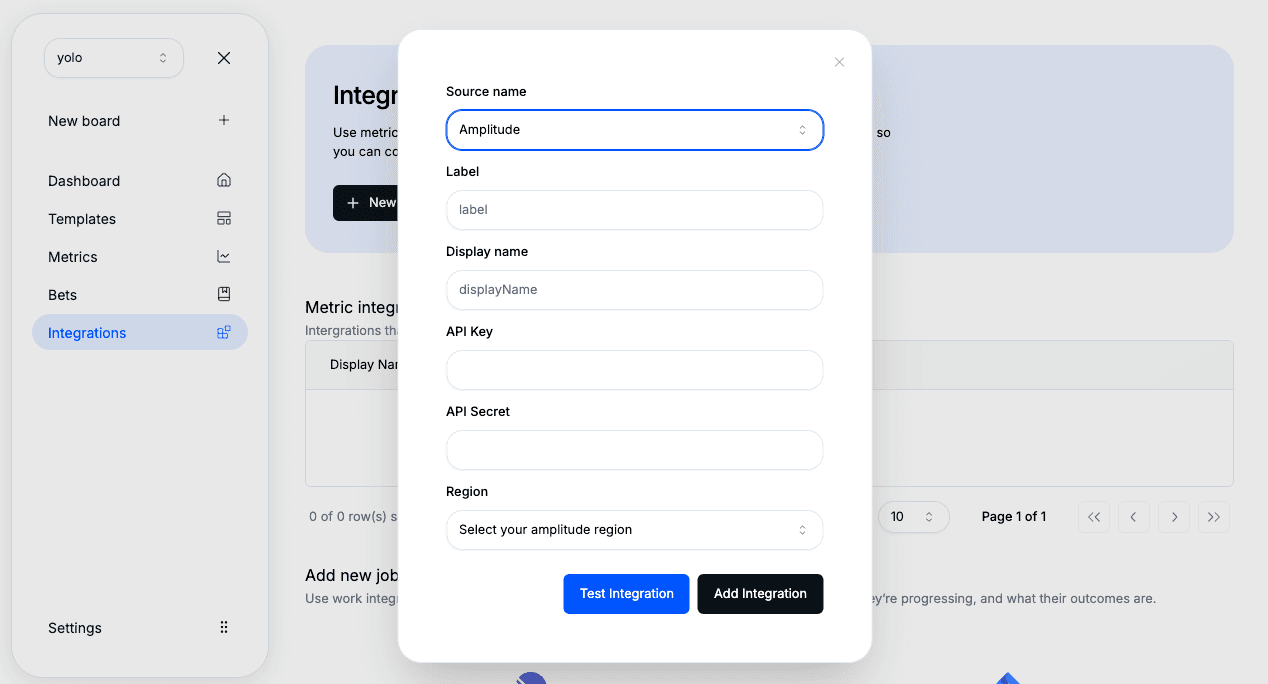
2. Add a New Integration
Click “New Integration” and select Amplitude as your source.
3. Enter Credentials
Provide your API Key and Secret Key. You can find these in your Amplitude project settings .
4. Save
Click Save — your Amplitude connection will appear in the integrations list.
Adding Amplitude as a Source to a Metric
1. Create or Edit a Metric
Go to your Metrics section and click New Metric (or edit an existing one).
2. Choose Source
Select Amplitude as the source type.
3. Pick Data Type
Choose between:
- Event — for direct event counts
- Chart — to pull data from a saved Amplitude chart
4. Provide Details
- For Event, enter the exact event name (case-sensitive).
- For Chart, paste your Amplitude chart URL (e.g.
https://app.amplitude.com/analytics/flow/chart/jkf5qy9b).
5. Save and Run Query
Click Update Metric → Run Query to pull your first dataset.
6. Verify Data
You’ll see your imported data in the Overview tab of your metric. From here, you can place it on a Flow Board and connect it to other metrics or bets.
Supported Source Types
| Source Type | Description | Example |
|---|---|---|
| Event | Imports time-series counts of a specific event. | “User Signed Up” or “Added to Cart” |
| Chart | Imports saved chart results directly from Amplitude. | Funnel or retention chart URL |
Data Refresh
Once connected, your Amplitude metrics refresh automatically based on the schedule you configure (daily by default). You can also trigger manual updates directly from the metric view.
Troubleshooting
If your data isn’t syncing as expected:
- Make sure your API Key and Secret Key have access to the correct project.
- Check that chart URLs are public or that your Amplitude permissions allow API access.
- Verify that event names match exactly (Amplitude is case-sensitive).
- Ensure the metric has enough historical data to render a time series.
If you’re still stuck, reach out to your Segflow support contact — we’re happy to help verify your connection.
Next Steps
- Learn more about Metric Sources
- Explore Metrics Introduction
- Connect other tools like Mixpanel or Postgres