Introduction
What Metrics Represent
Metrics are the measurable foundation of your strategy — the signals that reveal how your system behaves over time. They connect bets (what you do) with outcomes (what happens), forming the backbone of strategic learning in Segflow.
Where dashboards show results, metrics show relationships. They help teams understand why performance moves — not just whether it did.
Each metric represents a time series that evolves as your organization acts and learns. When combined across Flow Boards, these metrics form the analytical core of your Strategy Graph — a living map of cause and effect across the system.
How Metrics Fit Into the Strategy Graph
Metrics don’t exist in isolation. Their meaning comes from how they connect — to each other, to bets, and to outcomes.
These relationships are created visually inside Flow Boards:
- Bet → Metric — the bet contributes to improving the metric
- Metric → Metric — one metric drives or correlates with another
Once connected, metrics become part of the Strategy Graph — the system-level network Segflow uses to:
- Trace influence across metrics and bets
- Detect compounding loops and bottlenecks
- Power Strategic Analyses like Driver, Bet Impact, and Growth Loop Analysis
Every connection you create enriches the graph — teaching Segflow how your system really operates.
Relationships are created inside Flow Boards, ensuring every connection has clear strategic context.
Strategic Roles of Metrics
Not all metrics serve the same purpose. Segflow supports three strategic types that reflect different layers of your system:
| Type | Description | Example |
|---|---|---|
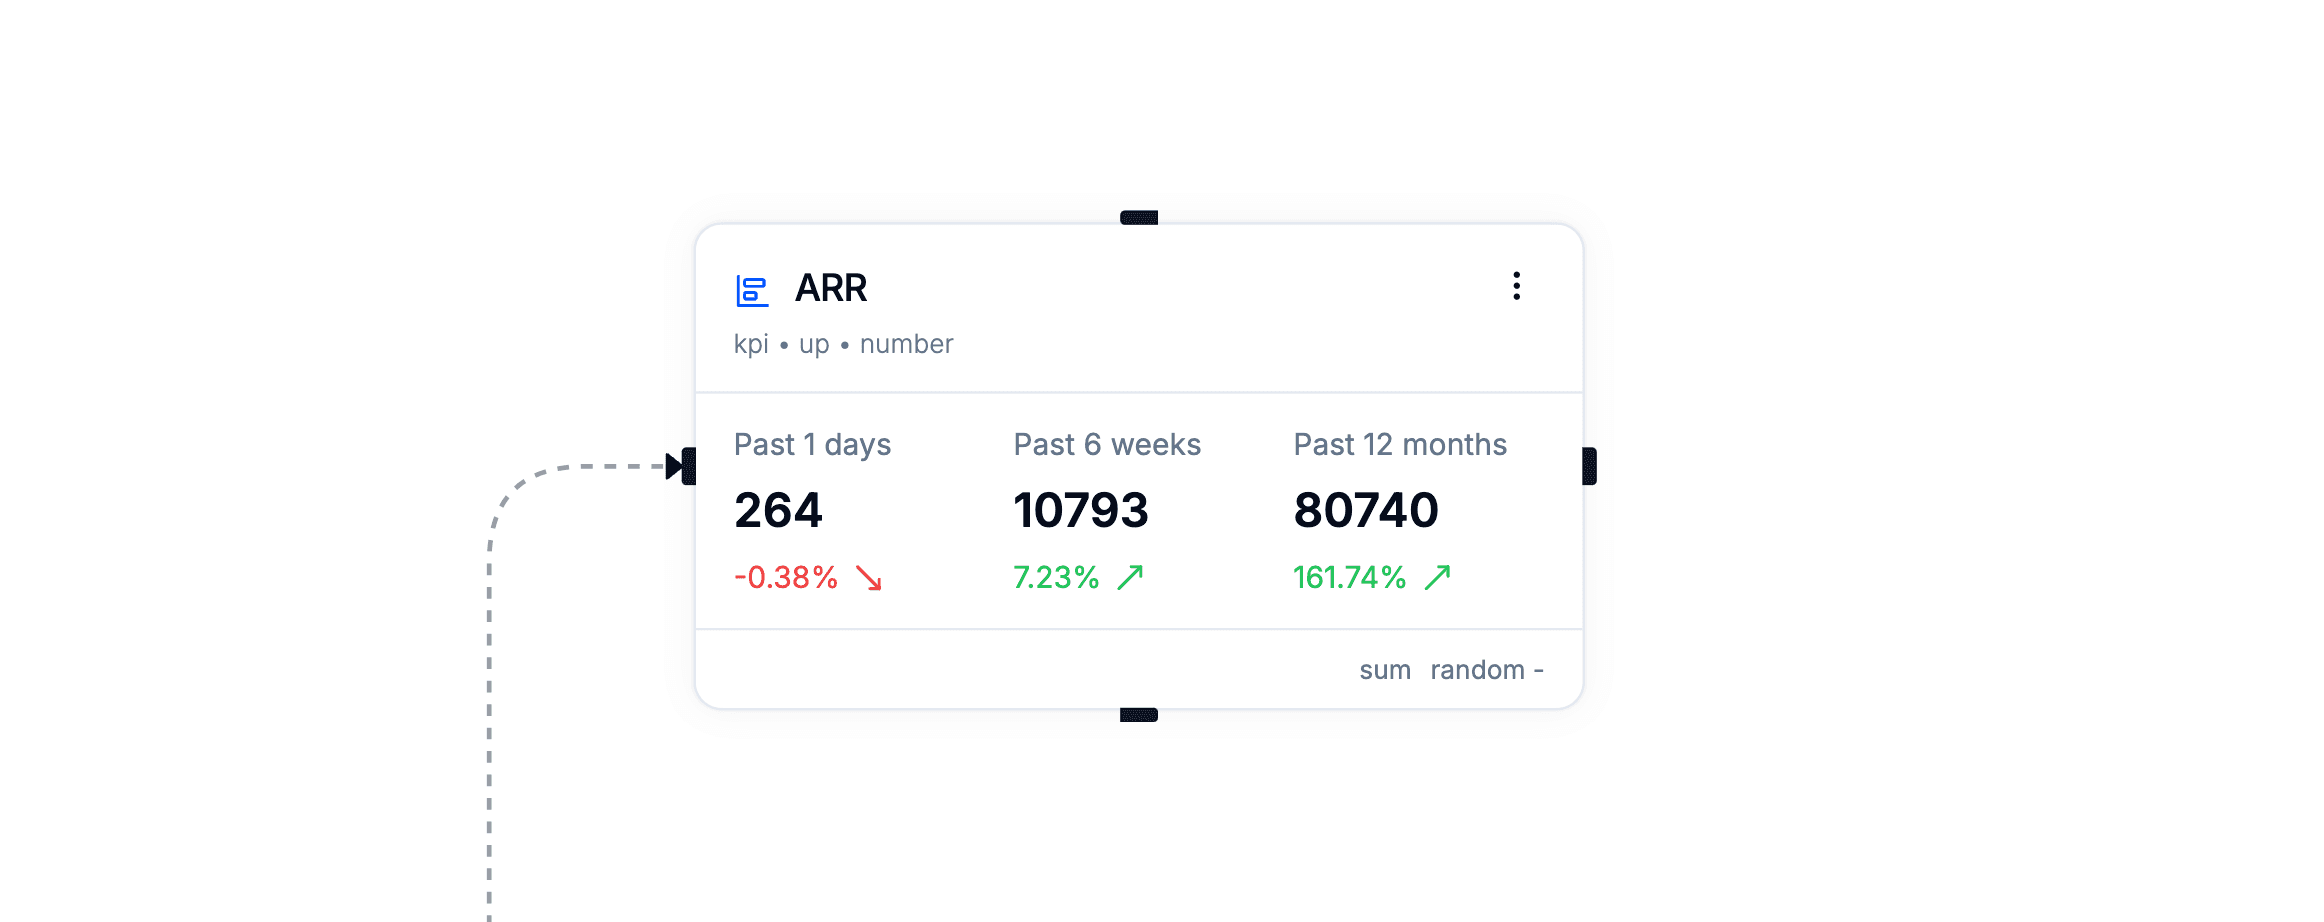
| North Star | Represents your ultimate measure of long-term success | ARR, Retention Rate |
| Goal | Tracks intermediate objectives that ladder up to your North Star | Conversion Rate, Weekly Active Users |
| Input | Measures the actions or conditions that drive your goals | Sign-up Completion Rate, Feature Usage, Campaign Reach |
This structure ensures that teams optimize for leverage, not vanity. When input metrics improve, they eventually move the goals and North Star metrics above them — forming a clear hierarchy of impact.
Metric Structure
Each metric in Segflow contains several components that reflect how data evolves over time and supports analytical precision.
1. Events (Time-Series Data)
Every metric collects events — the raw historical data points that record value over time. These values form the foundation for correlation, regression, and forecasting.
| Field | Description |
|---|---|
date | The point in time for the data value |
value | The recorded numeric value |
metricId | Reference to the metric this event belongs to |
These data points allow Segflow to detect seasonality, delayed effects, and emerging trends.
2. Intervals
Intervals summarize performance over defined periods — daily, weekly, monthly — making it easier to compare trends and rates of change.
| Field | Description |
|---|---|
total | Aggregated metric value over the period |
change | Difference from the previous interval |
length | Number of days included |
period | Period type (e.g., week, month, quarter) |
This helps normalize trends across uneven datasets and supports consistent comparison between metrics.
3. Goals
Goals define the target state you want to reach for a given metric. They help translate intent into measurable progress.
| Field | Description |
|---|---|
title | The name of the goal |
startDate / endDate | The timeframe for measurement |
targetValue | The intended outcome |
currentValue | Progress toward the goal |
aggregation | How data is rolled up (sum, average, increase, etc.) |
Goals help track alignment between expected impact and observed change, supporting both accountability and learning.
4. Forecasts
Forecasts use statistical models to predict future metric values based on historical patterns. They help teams anticipate trajectory and detect when performance deviates from expectation.
| Field | Description |
|---|---|
yHat | Predicted value |
yP10 / yP90 | Confidence intervals (10th–90th percentile) |
forecastHorizon | How far into the future the model predicts |
quality | Forecast accuracy (MAE, RMSE, MAPE) |
Forecasts are powered by time-series models (like Prophet) and continuously improve as new data arrives. They provide early signals of potential slowdowns, accelerations, or anomalies — especially useful before bet results are visible.
Working With Metrics
Creating a Metric
Metrics can be created manually or imported from your connected data sources.
Manual
- Go to Metrics
- Click New Metric
- Give it a name, description, and display format
- Select its strategic type (Input, Goal, or North Star)
- Save and start tracking data
From Integrations
- Connect your data source under Integrations
- Select which metrics to import
- Configure frequency and roll-up method
Editing and Managing
- Update names, descriptions, and strategic types as your strategy evolves
- Add or modify goals and targets
- Review forecasts to understand expected performance
- Metrics automatically update across all boards where they appear
Connecting Metrics in Flow Boards
To make metrics part of your strategic system:
- Open a Flow Board
- Add metrics that represent key drivers or outcomes
- Draw relationships between metrics or link them to bets
- Observe correlation, regression results, and systemic connections
These connections become the foundation for analyses and insight generation across your organization.
Best Practices
- Start simple — begin with 3–5 key metrics that represent your system’s core drivers
- Define direction clearly — specify whether up or down means improvement
- Set realistic goals — use goals as alignment tools, not performance traps
- Review forecasts regularly — use predicted vs. actual performance to learn faster
- Connect metrics early — relationships create meaning, not just measurement
Metrics are not static KPIs — they’re dynamic signals that evolve with your strategy. The more accurately you define and connect them, the stronger your strategic insight becomes.
Next Steps
- Explore how metrics connect through Flow Boards
- Learn how they power Strategic Analyses
- Set up data pipelines in Integrations