Postgres Integration
Connect your PostgreSQL database to power Segflow metrics with live data.
Overview
Segflow enables teams to align around data that drives strategic outcomes — not just dashboards. By connecting PostgreSQL, you can import time-series data from your production or analytics database directly into Segflow metrics.
This allows you to analyze how operational and behavioral data influence business KPIs, link them to bets on Flow Boards, and run advanced analyses across your connected system.
How It Works
Segflow connects securely to your PostgreSQL instance using standard connection credentials. It runs your defined SQL query and expects a consistent two-column output for each metric:
| Column | Type | Description |
|---|---|---|
date | DATE | The date for each time-series data point |
value | FLOAT or INTEGER | The metric value for that date |
Segflow stores this data as a time series for use in analysis, forecasting, and Flow Board relationships.
Segflow never modifies your database — it only executes read-only queries defined in your metric configuration.
Setup Instructions
1. Open Integrations in Segflow
In the sidebar, go to Integrations.
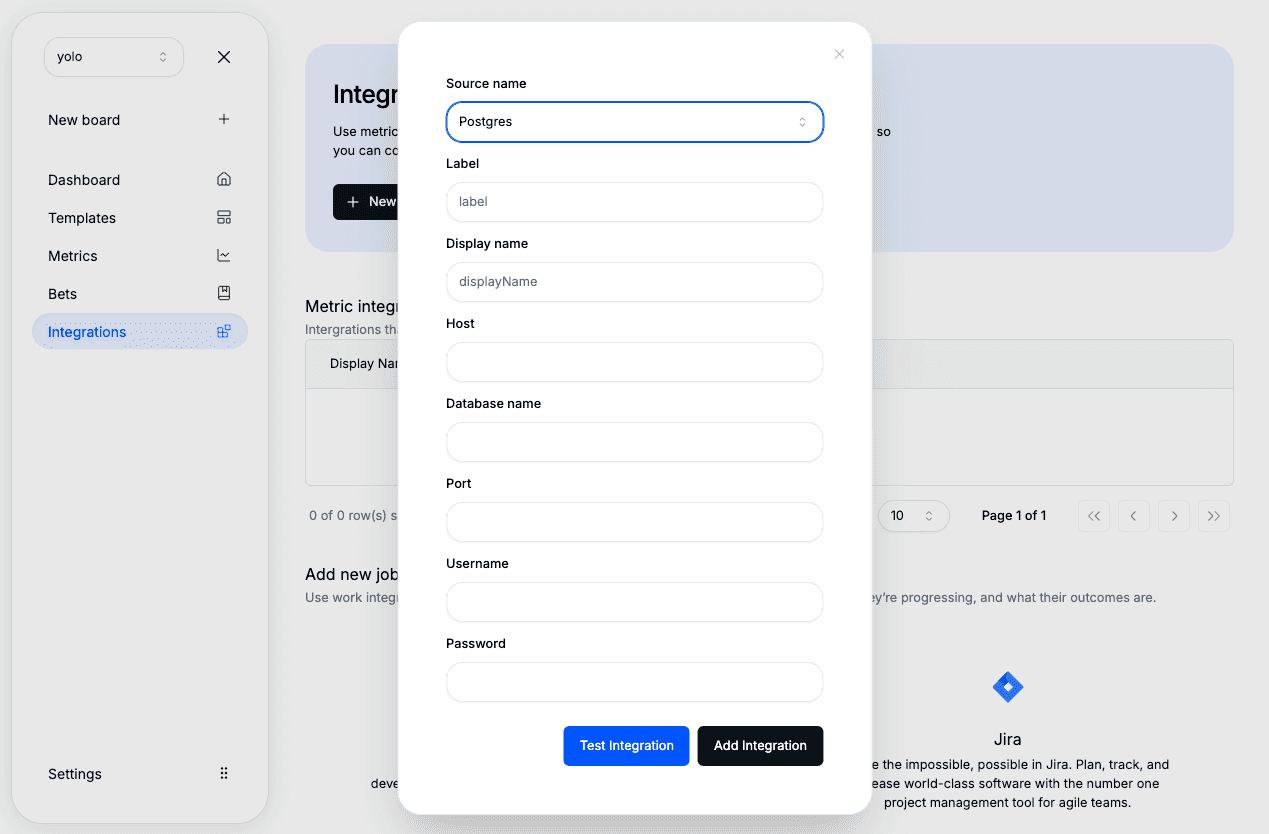
2. Add a New Integration
Click “New Integration”, then select Postgres as the source.
3. Enter Database Connection Details
Provide your PostgreSQL credentials:
| Field | Description |
|---|---|
| Host | Domain name or IP address of your PostgreSQL server |
| Port | Database port (default is 5432) |
| Database | Name of your database |
| Username | Database user with read permissions |
| Password | Password for the database user |
4. Save
Click Save — your PostgreSQL connection will now appear in the integrations list.
Adding Postgres as a Source to a Metric
1. Create or Edit a Metric
Go to the Metrics section and create a new metric (or edit an existing one).
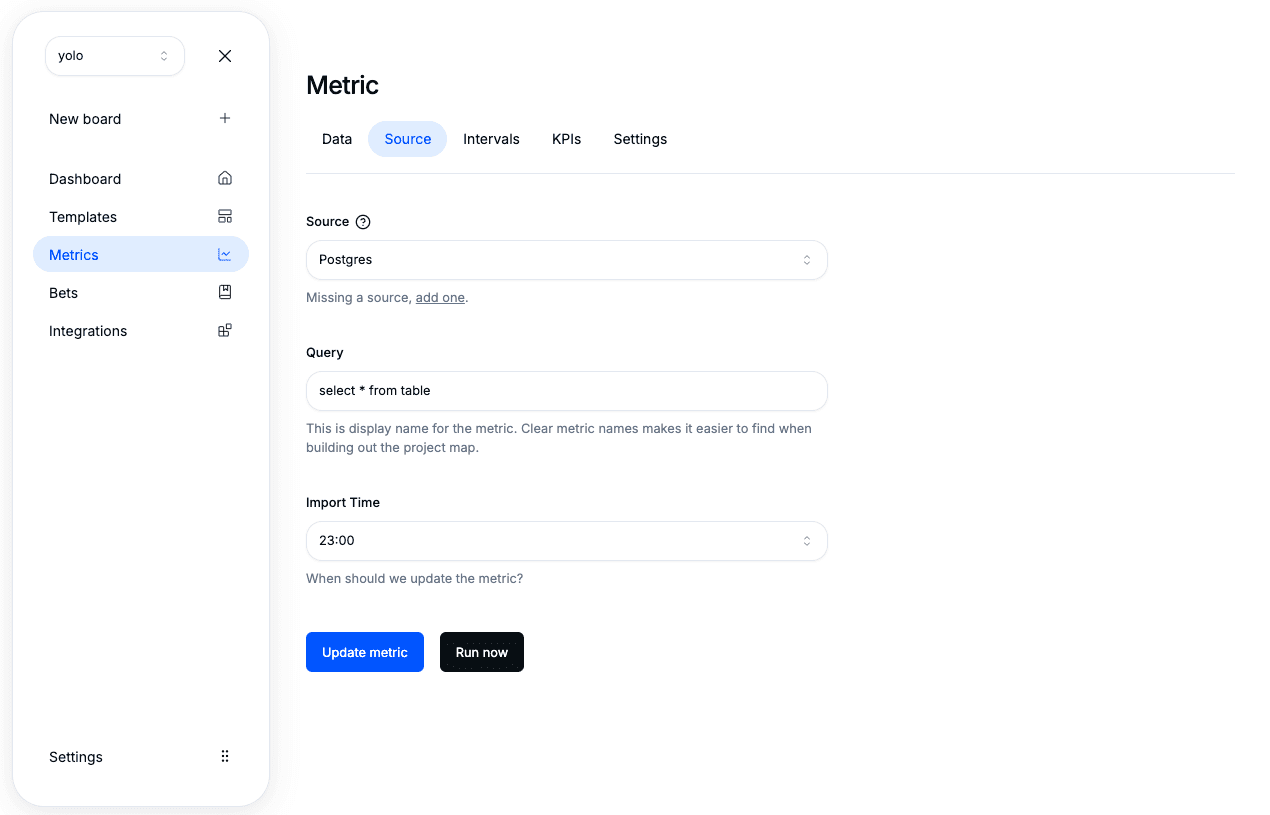
2. Choose Source
Select Postgres as the source type.
3. Write Your Query
Enter a valid SQL query that returns date and value columns.
We recommend testing the query directly in Postgres before saving.
4. Save and Run Query
Click Update Metric → Run Query to fetch your first dataset.
5. Verify Data
Once the query runs, you’ll see your time-series data visualized in the Overview tab. From there, you can connect the metric to bets or add it to Flow Boards to explore impact relationships.
Data Refresh
Postgres-based metrics refresh automatically according to your organization’s configured schedule (daily by default). You can also manually refresh any metric from its page to pull the latest data.
Troubleshooting
If your metric doesn’t load data or returns errors:
- Verify your connection details (host, port, database, username, password).
- Make sure your PostgreSQL instance allows connections from Segflow’s IP range (if applicable).
- Ensure your SQL query includes
dateandvaluecolumns. - Test your query directly in Postgres to confirm that it runs successfully.
- Check user permissions — the database user must have read-only access to the tables you’re querying.
Still having issues? Contact Segflow support — we can help validate your connection and query setup.
Next Steps
- Connect your warehouse with BigQuery
- Import behavioral data via Mixpanel or Amplitude
- Learn more about how metrics connect to Flow Boards and Strategic Analyses